Testing
Cocotb Introduction
Please Log In for full access to the web site.
Note that this link will take you to an external site (https://shimmer.mit.edu) to authenticate, and then you will be redirected back to this page.
Intro (and a note)
If you're reading this, you're in 6.S965 in the 2025th year of the Common Era. In many prior years we used Verilog/SystemVerilog (and really mostly just Verilog) for testbenching our digital designs in 6.205. Starting last year we tried to transition 6.205 to a Python-based framework, cocotb. I want us to do the same in 6.S965. We'll have to reuse a little bit of the intro stuff here as a result.
Everything on this page can (and probably should) be done on your laptop. This is us setting up a simulation environment with cocotb. It won't be going on the hardware. It is nice to be on your laptop, with a hot cup of whatever you drink. It is less nice to be in the overcrowded lab debugging on hardware. This is a great reason to really want to do thorough simulations (in addition to all the other great reasons).
Cocotb
Cocotb stands for Coroutine-based Cosimulation testbench environment, written in Python. Historically we've done all our testbenches and simulations in SystemVerilog in 6.205, but we're going to try an experiment this year of 2025 by using Cocotb instead. The reasons are several:
- It is written in and used with Python, a language you've all gotten experience with.
- It is a more modern testing framework, and since it is in Python, it allows us to compare our designs to models created using the vast array of Python libraries out there.
- We're hoping that by simulating with Python and by designing with SystemVerilog we'll avoid some of the historical confusion that arises between synthesizable and non-synthesizable SystemVerilog.
- It is honestly just more enjoyable to use once you get the hang of it and takes care of a lot of boilerplate stuff for us.
Getting Started
As a first step, make sure to install on your system Python cocotb. We can use the most up to date stable version, which as of late August 2025, is 1.9.2. We should really only be using pretty widely-supported libraries in 6.205 so install cocotb with either pip install cocotb or conda install cocotb.
In your project folder for this week make a new folder called sim if you haven't already. Inside of there, make a file called test_counter.py. In that file we're going to put the following:
import cocotb
import os
import random
import sys
import logging
from pathlib import Path
from cocotb.triggers import Timer
from cocotb.utils import get_sim_time as gst
from cocotb.runner import get_runner

#cheap way to get the name of current file for runner:
test_file = os.path.basename(__file__).replace(".py","")

@cocotb.test()
async def first_test(dut):
    """ First cocotb test?"""
    # write your test here!
	  # throughout your test, use "assert" statements to test for correct behavior
	  # replace the assertion below with useful statements
    assert False

"""the code below should largely remain unchanged in structure, though the specific files and things
specified should get updated for different simulations.
"""
def counter_runner():
    """Simulate the counter using the Python runner."""
    hdl_toplevel_lang = os.getenv("HDL_TOPLEVEL_LANG", "verilog")
    sim = os.getenv("SIM", "icarus")
    proj_path = Path(__file__).resolve().parent.parent
    sys.path.append(str(proj_path / "sim" / "model"))
    sources = [proj_path / "hdl" / "counter.sv"] #grow/modify this as needed.
    hdl_toplevel = "counter"
    build_test_args = ["-Wall"]#,"COCOTB_RESOLVE_X=ZEROS"]
    parameters = {}
    sys.path.append(str(proj_path / "sim"))
    runner = get_runner(sim)
    runner.build(
        sources=sources,
        hdl_toplevel=hdl_toplevel,
        always=True,
        build_args=build_test_args,
        parameters=parameters,
        timescale = ('1ns','1ps'),
        waves=True
    )
    run_test_args = []
    runner.test(
        hdl_toplevel=hdl_toplevel,
        test_module=test_file,
        test_args=run_test_args,
        waves=True
    )

if __name__ == "__main__":
    counter_runner()
In your project folder, also have a hdl folder, and in there, make sure to make a new file called counter.sv and put in the following counter module.
module counter(
        input wire clk,
        input wire rst,
        input wire [31:0] period,
        output logic [31:0] count
    );

    always_ff @(posedge clk)begin
        if (rst)begin
            count <= 0;
        end else begin
            if (count+1 >= period)begin
                count <= 0;
            end else begin
                count <= count + 1;
            end
        end
    end
endmodule
If you then run this file from within sim, (python test_counter.py) a bunch of text will fly by like this. It might be overwhelming, but you should see something like "FAIL" in it.
     0.00ns INFO     cocotb.regression                  Found test test_counter.first_test
     0.00ns INFO     cocotb.regression                  running first_test (1/1)
                                                          First cocotb test?
     0.00ns INFO     cocotb.regression                  first_test failed
                                                        Traceback (most recent call last):
                                                          File "/Users/jodalyst/cocotb_development/pwm_1/sim/test_counter.py", line 19, in first_test
                                                            assert False
                                                        AssertionError
     0.00ns INFO     cocotb.regression                  **************************************************************************************
                                                        ** TEST                          STATUS  SIM TIME (ns)  REAL TIME (s)  RATIO (ns/s) **
                                                        **************************************************************************************
                                                        ** test_counter.first_test        FAIL           0.00           0.00          5.84  **
                                                        **************************************************************************************
                                                        ** TESTS=1 PASS=0 FAIL=1 SKIP=0                  0.00           0.01          0.09  **
                                                        **************************************************************************************
As it stands, this testbench isn't doing anything. The code that is actually testing our "Device Under Test" (the dut) which is the first_test coroutine doesn't actually do anything. Instead at the end it just asserts False (which is equivalent to saying things have failed).
What we need to do is set inputs and evaluate the outputs of our module (the counter). And the first step in doing that is to put values on the connections.
Setting wire values
To set a value, we can access it like shown below. Cocotb builds up a access object for the DUT which allows easy specification of it. The counter that you wrote has three inputs:
clkrstperiod
dut.rst.value = 1 # set the value of input wire rst to be high (1)
Any named port of our module can be accessed using the syntax above, and its value can be set to be high or low. For multi-bit ports, the value can instead be set to any integer value. For example, the following would be a reasonable set of inputs to "start up" the counter for use in a 4-bit PWM module. Remember, dut.clk refers to the signal, not the value of the signal, so doing dut.clk = 1 is meaningless and wrong.
    dut.clk.value = 0
    dut.rst.value = 1
    dut.period.value = 15
Reading values
Reading values can be done basically in the same way but backwards:
read_value = dut.count.value
print(read_value)
Any output logic, input wire, or internal register can be read during the simulation—you can use assertions on these values to prove that your design is functioning as intended.
You can also check the outputs of your module using assert statements. Perhaps at some point in your test you want to make sure the output of the counter is 13. Well you can do the following:
assert dut.count.value == 13 # only allow test case to pass if the read value is what you want it to be (13 in this example)
Passage of Time
All simulations, even non-sequntial ones, need some simulation time to pass in order to actually simulate (we'll talk about this on Monday, Sept 8th's lecture some). In order to do this, you can use a Timer construct to allow some time to pass. For example if you wanted to turn on the reset signal, wait 10 nanoseconds, and then turn it off you could do something like:
dut.rst.value = 1
await Timer(10, units="ns")
dut.rst.value = 0
It’s important to remember that the Timer has nothing to do with how long our Python script runs for! Our simulation will run slower than in real-time; the 10 nanosecond value represents passage of simulation time!
Viewing Signals Over Time
Once you are having your simulation exist over time, simply viewing printouts of values is not super productive. Instead what we usually like to do is generate waveforms. Cocotb has already been configuring this for us in the background. When it runs, a folder called sim_build gets generated inside your sim folder (or possibly above it depending on where you call the test file from. In there will be a file with a .fst extension. That is a form of wavefile that can be viewed with either GTKWave or Surfer (and possibly an online one, though I'm not sure if we'll get that working or not yet).
Open up that waveform viewer, open the generated FST and you can see the signals.
If you then have your test coroutine specified as such:
@cocotb.test()
async def first_test(dut):
    """ First cocotb test?"""
    dut.rst.value = 1
    dut.clk.value = 0
    dut.period.value = 15
    await Timer(10, units="ns")
    dut.rst.value = 0
    assert False
And then run, first you'll now see that your simulation ends not at 0ns but rather 10 ns
    10.00ns INFO     cocotb.regression                  first_test failed
                                                        Traceback (most recent call last):
                                                          File "/Users/jodalyst/cocotb_development/pwm_1/sim/test_counter.py", line 19, in first_test
                                                            assert False
                                                        AssertionError
    10.00ns INFO     cocotb.regression                  **************************************************************************************
                                                        ** TEST                          STATUS  SIM TIME (ns)  REAL TIME (s)  RATIO (ns/s) **
                                                        **************************************************************************************
                                                        ** test_counter.first_test        FAIL          10.00           0.00      26667.03  **
                                                        **************************************************************************************
                                                        ** TESTS=1 PASS=0 FAIL=1 SKIP=0                 10.00           0.01        826.04  **
                                                        **************************************************************************************
A waveform file will have been generated. If you view it with the waveform viewer you'll see something like the following:
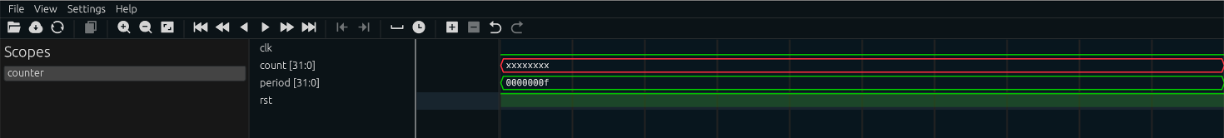
It is pretty useless. What we're missing is our clock signal that actually runs our system.
Driving a Clock + Helper Functions
Nearly every design we test will require a clock input, and to simulate our design with a clock, we’ll need a little helper function, a lot like the one below:
async def generate_clock(clock_wire):
	  while True: # repeat forever
		    clock_wire.value = 0
		    await Timer(5,units="ns")
		    clock_wire.value = 1
		    await Timer(5,units="ns")
Notice the term async in the function’s definition; this is short for asynchronous. Don’t worry too much about what it’s doing within Python, but know that it, unlike normal lines of code in Python, can run “at the same time” as other code, rather than entirely in order. This is very helpful for this function, where we want to have the clock value constantly changing back and forth while other values are changing! To start this function running in the background of our normal test, call it within your function with await cocotb.start().
The async nature of cocotb is what makes it work. You set up numerous little "workers" that turn on signals periodically or check signals periodically and in the process you can more easily write simulation constructs. You don't have to obsess over the line-by-line creation of a "script" for checking, but instead you should think as if you're issuing high-level directives to these workers to do their things.
# inside your test function: starts generate_clock running in the background
await cocotb.start( generate_clock( dut.clk ) )
async def generate_clock(clock_wire):
	  while True: # repeat forever
		    clock_wire.value = 0
		    await Timer(5,units="ns")
		    clock_wire.value = 1
		    await Timer(5,units="ns")

@cocotb.test()
async def first_test(dut):
    """First cocotb test?"""
    await cocotb.start( generate_clock( dut.clk ) ) #launches clock
    dut.rst.value = 1
    dut.period.value = 3
    await Timer(5, "ns")
    await Timer(5, "ns")
    dut.rst.value = 0 #rst is off...let it run
    count = dut.count.value
    dut._log.info(f"Checking count @ {gst('ns')} ns: count: {count}")
    await Timer(5, "ns")
    await Timer(5, "ns")
    count = dut.count.value
    dut._log.info(f"Checking count @ {gst('ns')} ns: count: {count}")
    await Timer(5, "ns")
    await Timer(5, "ns")
    count = dut.count.value
    dut._log.info(f"Checking count @ {gst('ns')} ns: count: {count}")
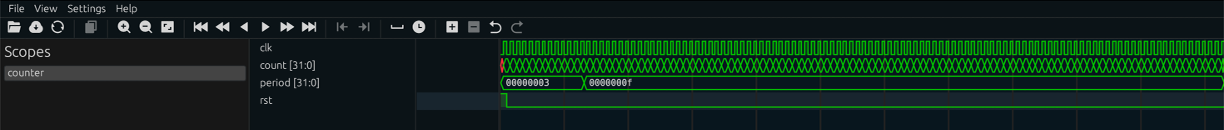
If you now run this you'll see something like the following.

Let's let the simulation run for a bit longer. Add the following:
    #add to end of first_test
    await Timer(100, "ns")
    dut.period.value = 15
    await Timer(1000, "ns")
Mess With this Hardware Testbench
Using all these components, and digging through the cocotb documentation expand on the cocotb test for the module we saw above! Try to have your test do these things:
- First starts a background clock generator to drive the
clk_insignal - Begins by setting the
rst_insignal high for at least one clock cycle - Ensures that after a reset signal, the
count_outvalue is set to zero - Sets the
period_invalue to some "low" value that you can let run and overflow several times - Sets the
period_into a higher value - Make sure in the wave file that when
rst_inis set to 1 mid-count and held for at least one clock cycle, the system goes to 0 on itscount_outand stays at 0 untilrst_inis deasserted back to 0, at which pointcount_outstarts to grow as expected again.
Note: for this first testbench, we have a correct SystemVerilog design in front of us, so it’s easy to reason through exactly what our testbench should check for, but it's important to build testbenches that match our specified behavior, rather than our Verilog code, so that we can catch when we misunderstood what exactly should be output from the hardware. When we test your testbench (ooh inception) we'll be testing it on more SystemVerilog than just what we showed you above!
hdl and sim folder contens) here.

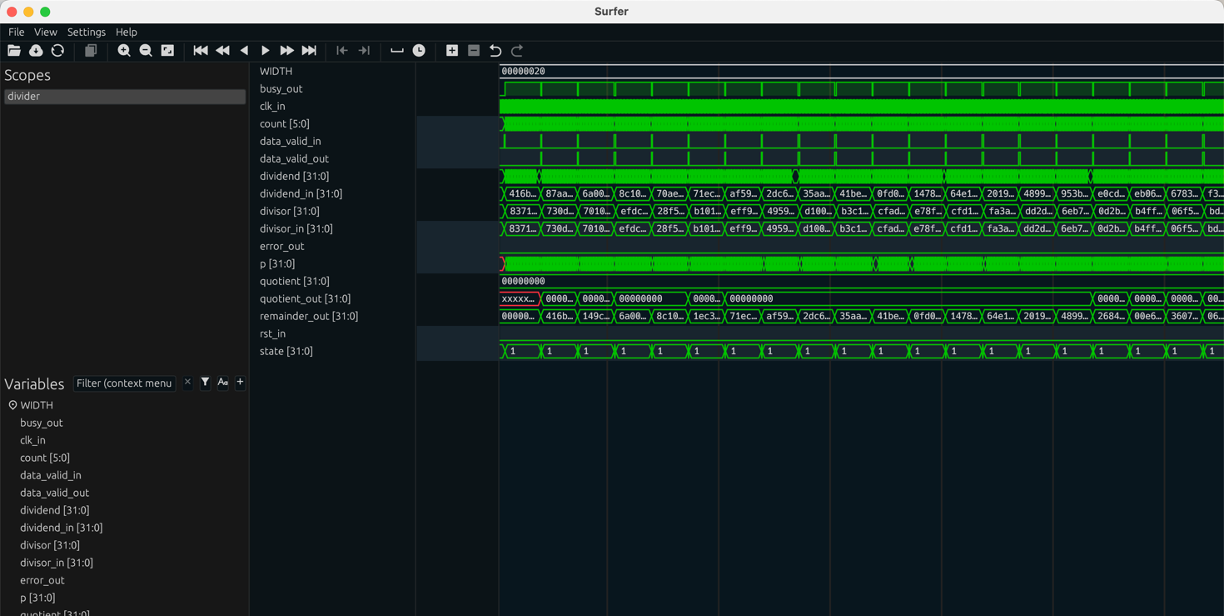
A More Complicated Module
OK let's try again with a more complicated module and see where all of this can go. Consider this "blocking" and imperfect integer divider that we wrote in 6.205 previously, yeah there's some issues, but we really just want something to test right now.
module divider #(parameter WIDTH = 32)
    (   input wire clk_in,
        input wire rst_in,
        input wire[WIDTH-1:0] dividend_in,
        input wire[WIDTH-1:0] divisor_in,
        input wire data_valid_in,
        output logic[WIDTH-1:0] quotient_out,
        output logic[WIDTH-1:0] remainder_out,
        output logic data_valid_out,
        output logic error_out,
        output logic busy_out
    );
    logic [WIDTH-1:0] quotient, dividend;
    logic [WIDTH-1:0] divisor;
    logic [5:0] count;
    logic [31:0] p;
    enum {IDLE, DIVIDING} state;
    always_ff @(posedge clk_in)begin
        if (rst_in)begin
            quotient_out <= 0;
            dividend <= 0;
            divisor <= 0;
            remainder_out <= 0;
            busy_out <= 1'b0;
            error_out <= 1'b0;
            state <= IDLE;
            data_valid_out <= 1'b0;
            count <= 0;
        end else begin
            case (state)
                IDLE: begin
                    if (data_valid_in)begin
                        if (divisor_in==0)begin
                            quotient_out <= 0;
                            remainder_out <= 0;
                            data_valid_out <= 1;
                            error_out <= 1;
                            busy_out <= 0;
                            state <= IDLE;
                        end else begin
                            state <= DIVIDING;
                            quotient_out <= 0;
                            dividend <= dividend_in;
                            divisor <= divisor_in;
                            busy_out <= 1'b1;
                            error_out <= 1'b0;
                            count <= 31;//load all up
                            p <= 0;
                            data_valid_out <= 0;
                        end
                    end else begin
                        data_valid_out <= 1'b0;
                    end
                end
                DIVIDING: begin
                    if (count==0)begin
                        state <= IDLE;
                        if ({p[30:0],dividend[31]}>=divisor[31:0])begin
                            remainder_out <= {p[30:0],dividend[31]} - divisor[31:0];
                            quotient_out <= {dividend[30:0],1'b1};
                        end else begin
                            remainder_out <= {p[30:0],dividend[31]};
                            quotient_out <= {dividend[30:0],1'b0};
                        end
                        busy_out <= 1'b0; //tell outside world i'm done
                        error_out <= 1'b0;
                        data_valid_out <= 1'b1; //good stuff!
                    end else begin
                        if ({p[30:0],dividend[31]}>=divisor[31:0])begin
                            p <= {p[30:0],dividend[31]} - divisor[31:0];
                            dividend <= {dividend[30:0],1'b1};
                        end else begin
                            p <= {p[30:0],dividend[31]};
                            dividend <= {dividend[30:0],1'b0};
                        end
                            count <= count-1;
                    end
                end
            endcase
        end
    end
endmodule
It'd be really cool if we could test this thing kinda rigorously by giving it a bunch of values and comparing them to known correct results. Obviously the best way to do this would be to look at the waveform and then check the inputs and outputs manually like a peasant, going through each one and typing it into google search for it to give the answer. You could probably average two or three tests a minute that way...not to bad. There's unfortunately no way to do this better or more efficiently....said no one ever.
We should, of course, use programming for this. We should use programming to test the division, we should use programing to do the actual grabbing of values an checking them. It is all there. We just have to take it.
For example, Python has the numpy library, one of the greatest accomplishments of humanity...we could write a simple reference model to validate our Verilog divider against:
import numpy as np
def divider_model(dividend:int, divisor:int):
    x = np.uint32(dividend)
    y = np.uint32(divisor)
    return dict(quotient=x//y, remainder=x%y)
Then you could pick random numbers for inputs, let the module run, get its outputs and then compare the results to what this model says. A few lines like this is the right idea:
        #...inside a larger looping test where dividend and divisor are being fed
        #set values for dividend and divisor
        expected = divider_model(dividend, divisor)
        dut.dividend_in.value = dividend
        dut.divisor_in.value = divisor
        dut.data_valid_in.value = 1
        # some stuff to figure out....wait.....(your job)
        eq = expected['quotient']
        er = expected['remainder']
        aq = dut.quotient_out.value.integer
        ar = dut.remainder_out.value.integer
        assert eq==aq and er==ar, f"Error! at Input: {dividend},{divisor}. Expected: {eq}, {er}. Actual {aq}, {ar}"
        dut._log.info(f"Input: {dividend},{divisor}. Expected: {eq}, {er}. Actual {aq}, {ar}")
        # continue with test
Your assignment is to generate a cocotb testbench that generates 100 random pairs of 32 bit integers, feeds them into your divider module, and then compares the result to the proven result provided by Numpy's 32 bit divider.
When I got mine running a glimpse of the output was:
 29770.00ns INFO     cocotb.divider                     Input: 3939614782,40975730. Expected: 96, 5944702. Actual 96, 5944702
 30100.00ns INFO     cocotb.divider                     Input: 2779440274,3336900497. Expected: 0, 2779440274. Actual 0, 2779440274
 30430.00ns INFO     cocotb.divider                     Input: 76011361,1578296099. Expected: 0, 76011361. Actual 0, 76011361
 30760.00ns INFO     cocotb.divider                     Input: 1877287487,1723166009. Expected: 1, 154121478. Actual 1, 154121478
 31090.00ns INFO     cocotb.divider                     Input: 2672559006,3850064151. Expected: 0, 2672559006. Actual 0, 2672559006
 31420.00ns INFO     cocotb.divider                     Input: 3608555949,2522181991. Expected: 1, 1086373958. Actual 1, 1086373958
 31750.00ns INFO     cocotb.divider                     Input: 2775662358,2015463329. Expected: 1, 760199029. Actual 1, 760199029
 32080.00ns INFO     cocotb.divider                     Input: 3699613303,102741952. Expected: 36, 903031. Actual 36, 903031
 32410.00ns INFO     cocotb.divider                     Input: 3578805553,778319440. Expected: 4, 465527793. Actual 4, 465527793
 32740.00ns INFO     cocotb.divider                     Input: 1557989783,1331095018. Expected: 1, 226894765. Actual 1, 226894765
 33070.00ns INFO     cocotb.divider                     Input: 1568599011,1851659359. Expected: 0, 1568599011. Actual 0, 1568599011
 33070.00ns INFO     cocotb.divider                     Done
 33070.00ns INFO     cocotb.regression                  divider_basic_test passed
 33070.00ns INFO     cocotb.regression                  *****************************************************************************************
                                                        ** TEST                             STATUS  SIM TIME (ns)  REAL TIME (s)  RATIO (ns/s) **
                                                        *****************************************************************************************
                                                        ** test_divider.divider_basic_test   PASS       33070.00           0.12     281822.93  **
                                                        *****************************************************************************************
                                                        ** TESTS=1 PASS=1 FAIL=0 SKIP=0                 33070.00           0.16     209689.84  **
                                                        *****************************************************************************************
When to Do Things? (Triggers)
You should be able to determine how to pick random numbers and write a freakin' for loop in Python, so I won't insult your intelligence by going over that...but the thing that might be less intuitive to you is when and how to set inputs to the module and when and how to analyze those inputs. The divider module above gets inputs applied to it (on dividend_in and divisor_in) and you tell them they are valid by asserting valid_in. You then have to wait for it to calculate, until it asserts valid_out, which indicates its result is present on (quotient_out and remainder_out). How can you tell cocotb to wait? By using cocotb triggers. You've actually already used one earlier...the Timer is a trigger. When you say await Timer(10, units="ns") you're essentially telling your test to await until 10 ns have passed. During the that time, the piece of code which called await has yielded control to the trigger and control is only handed back when 10 ns has passed.
In looking through cocotb triggers you can see there are many other types of triggers, many of which can be associated with different signals.
There are a few in particular that are going to be very important to us in this class, RisingEdge, FallingEdge, and ReadOnly.
RisingEdgeis a trigger that can be associated with a signal and will block until the signal it is monitoring goes from low to high.FallingEdgeis a trigger that can be associated with a signal and will block until the signal it is monitoring goes from high to low.ReadOnlyis a trigger that will block until the given simulation step "stabilizes." We'll talk more about this in Week 2, but this essentially boils down to making sure you're only evaluating actual results of the simulation and not "temporary" values that signals might be at in the process of resolving during any given timestep! Failure to keep this in mind can cause a lot of confusing bugs to show up where things appear to act wrong.
Now you may think the best choice here would be to put some values into the divider, trigger it, and then do await RisingEdge(dut.data_valid_out) and while that can sometimes work, as we get more involved in our simulations, we can run into the exact same sort of bugs that show up in the actual hardware design as when you start clocking your flip flops off of non-clock signals....remember how you should not do something like this in HDL?:
always_ff @(posedge some_non_clock_signal)begin
    x <= y + x;
end
The reason is that it makes it very hard to satisfy setup and hold conditions of the flops because they're all flipping and flopping on unsynchronized signals....we should always do things like:
always_ff @(clock_signal)begin
    if (some_non_clock_signal)begin
        x <= y + x;
    end
end
In order to have our simulations reliably interact with our SystemVerilog designs we're therefore going to want to only analyze the state of the dut at rising edges of the clock and after the simulation timestep has stabilized into the "read only" phase. This means wherever in your particular coroutine simulation you are you would want to do something like:
    await RisingEdge(dut.clk_in)
    await ReadOnly()
    #you are free to read signals here and/or compare them to models
    # for example:
    if (dut.data_valid_out.value == 1):
        #do stuff
The question becomes when should you write inputs to modules under test. Ideally we'd do it right after we've analyzed the output/state of our system above. That thought isn't wrong, but if you did something like:
    await RisingEdge(dut.clk_in)
    await ReadOnly()
    #you are free to read signals here and/or compare them to models
    # for example:
    if (dut.data_valid_out.value == 1):
        #do stuff
        #etc...
    #now set inputs:
    dut.data_valid_in.value = 1
When you run your simulation, you'll almost 100% get an error like this:
Exception: Write to object dividend_in was scheduled during a read-only sync phase
What's happening is that you've not allowed any time to pass in simulation so you're trying to change signals at a point in the simulation step where things are locked-in, and can only be read (the read only phase).
What we need to do is move simulation time forward a smidge. You could do it with a timer, and that's fine but that's only ok if you make your timer smaller than the period of the clock and that involves knowing the clock. What is more robust is to actually use the falling edge of the clock as an event. It is sufficiently after the rising edge, but sufficiently before the next rising edge to work well. So this means something like this:
    await RisingEdge(dut.clk_in)
    await ReadOnly()
    #you are free to read signals here and/or compare them to models
    # for example:
    if (dut.data_valid_out.value == 1):
        #do stuff
        #etc...
    await FallingEdge(dut.clk_in)
    #now set inputs:
    dut.data_valid_in.value = 1
There will be exceptions to this samplign pattern, but at least for this lab, keep these things in mind. When we start to write actual, proper Monitors, we'll likely do things a bit differently, but we're laying out a few of these "triggers" right now so their weirdnesses are front-and-center in our minds!
This pattern of when to read and write is really only applicable to positive-edge-clock triggered logic. Thankfully that is almost all of what we'll deal with in this class, but if you do end up needing other signaling like DDR (double-data-rate), negative-edge-clock triggered logic, your sampling and injection points will need to be rethought out!
So Conclusions:
- When you want to Read and analyze signals and the state of a system you should do that:
- At the rising edge of the system clock (
RisingEdge(dut.clk_in)) - Once the system's values have stabilized (
ReadOnly())
- At the rising edge of the system clock (
- When you want to Inject inputs to a system you should do that:
- At the falling edge of the system clock (
FallingEdge(dut.clk_in))
- At the falling edge of the system clock (
With this all in mind, write a testbench for the divider that will try and compare and validate 100 inputs and outputs. Use assert to verify each case and feel free to have some dut._log lines so there's some line-by-line updates as you go.
divider_tester.py file here.